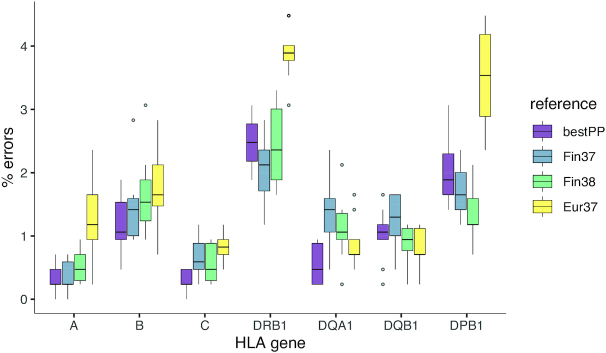
Figure 2.
Impact of HIBAG reference data on imputation error. HLA genes are on the x-axis and the y-axis shows the number of imputation errors based on the test data (n = 213). The box plots (Tukey) show the error distributions from 100 bootstraps of the test data. ‘Fin37’ and ‘Fin38’ denote the Finnish reference on genome builds GRCh37 and GRCh38, respectively, and ‘Eur37’ denotes the European reference on GRCh37 (i.e. the HIBAG default built on the 1958 British birth cohort, Wellcome Trust Case Control Consortium). ‘bestPP’ indicates the selection of the best imputation reference according to HIBAG posterior probability.

