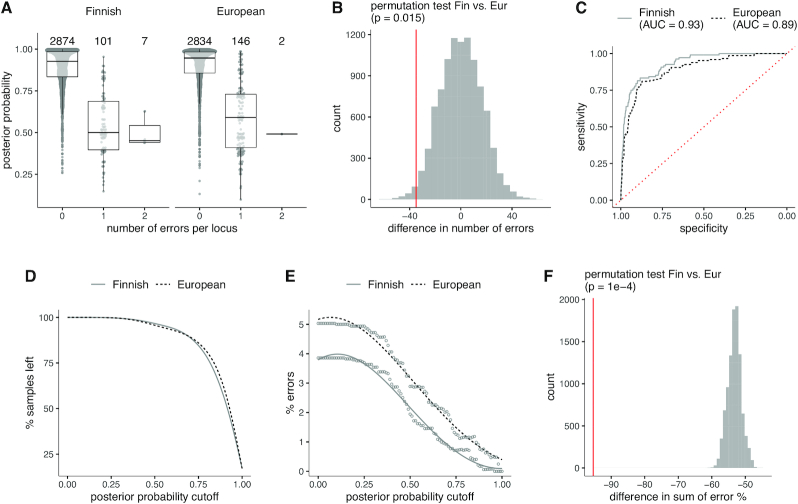
Figure 3.
Imputation accuracy relative to HIBAG posterior probability. (A) HIBAG posterior probability distributions by the number of imputation errors per gene (x-axis) for the Finnish and European reference panels. (B) Statistical permutation test for the difference in total number of errors between the Finnish and European reference panels. (C) AUC/ROC analysis of imputation accuracy using posterior probabilities. One or two errors were grouped into a single category and analyzed against zero errors. (D) Proportion of retained samples by posterior probability threshold. A sample is discarded if its probability falls below a threshold value (x-axis). (E) Imputation error rate over the posterior probability threshold values (x-axis) for the Finnish and European reference panels. (F) Statistical permutation test for the difference in total error rate. The analyzed quantity is the sum of error rates over the probability threshold values. In all analyses, both the Finnish and European reference panels are in GRCh37/hg19 genome build coordinates.

