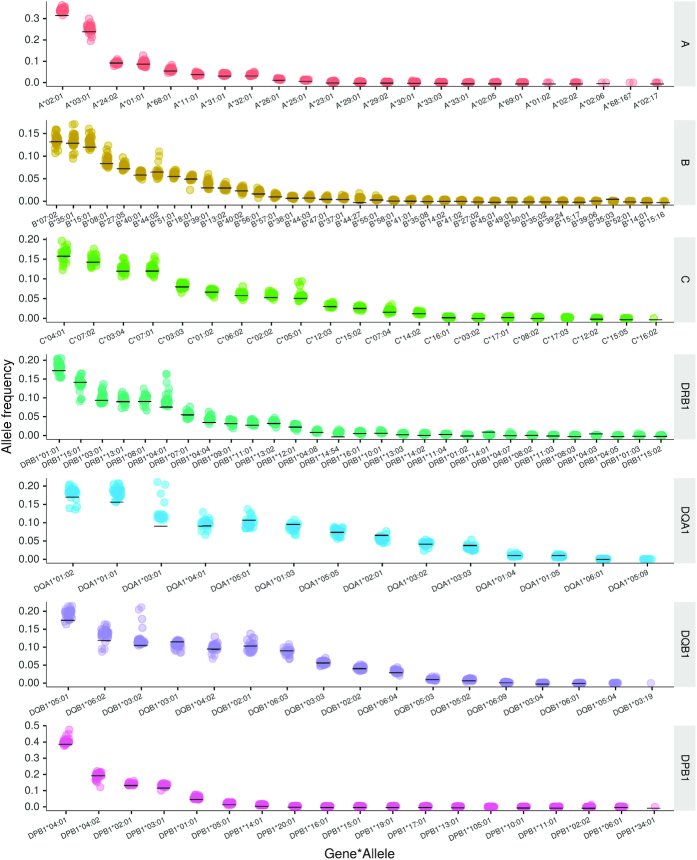
Figure 4.
Congruency of the imputed HLA allele frequencies and the clinical-grade HLA frequencies. Imputed HLA allele frequencies from the FinnGen R2 genotyping batches (total subjects n ∼ 102 000) in comparison with frequencies from an independent, clinical-grade HLA-typed Finnish dataset (n ∼ 25 000). The horizontal black bars indicate the population frequencies from the independent dataset. Each colored data point represents FinnGen R2 genotyping batch (the total number of genotyping batches is 32).

