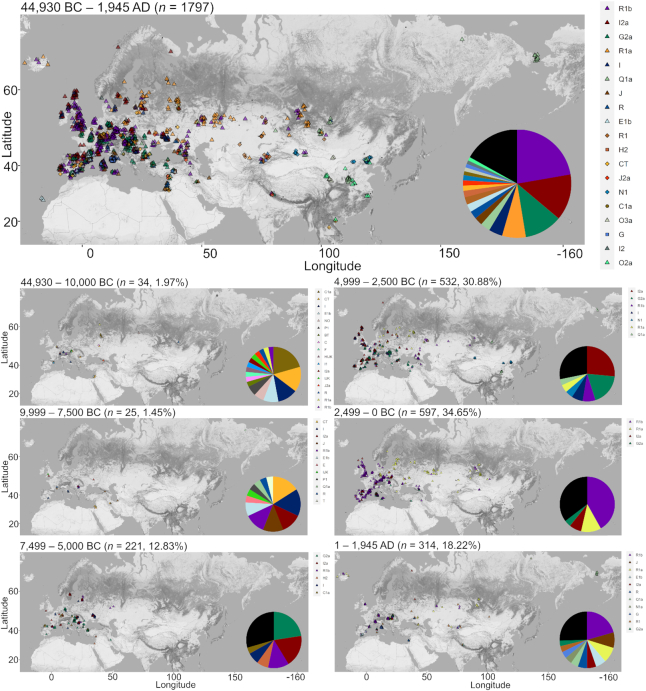
Figure 1.
The geographical distribution of 1723 ancient Eurasian haplogroups over time. The location of each archaeological site is marked as a dot. Colored shapes denote the different haplogroups found on the site. A small random variation was used in the plotting to avoid cluttering. Low-frequency haplogroups (<3% in interval maps, <1% in ‘all time periods’ map) are represented as black wedges in the pie charts and their corresponding locations marked as black crosses on the maps.

