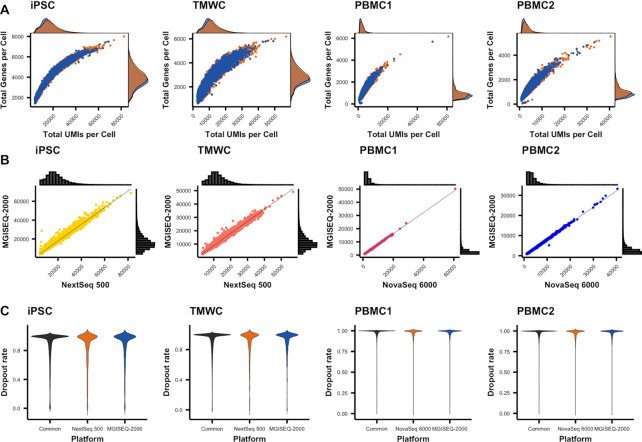
Figure 2.
Cells and genes detected by platforms. Both technologies demonstrated similar sensitivity in the detection of cells and genes. (A) Capture efficiency of each platform. Efficiency is evaluated based on the number of genes and molecules detected in a cell. (B) Total number of molecules detected in a cell. Histograms on each axis represent the distribution of total UMIs in a cell, while the scatter plot represents the correlation of UMI detection for a cell, between the two platforms. (C) Dropout rate across genes detected by platform. Dropout rates for each gene, per platform were calculated using NBDrop from the M3Drop package.

