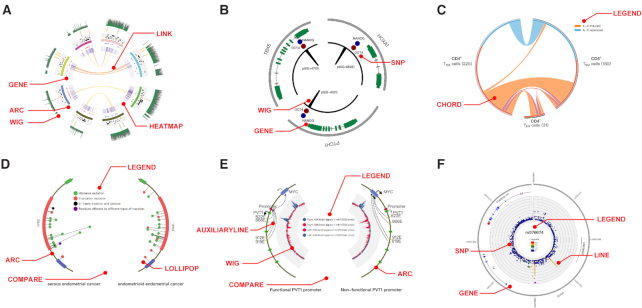
Figure 1.
Demos of NG-Circos. (A) Complex published Circos plots reproduced using NG-Circos; detailed descriptions can be found in Akdemir et al. (15). (B) Demo showing gene structures using NG-Circos; data are from Akdemir et al. (15). (C) Demo of Chord plot showing the IL-6-regulated gene changes in different cells (17). (D) Demo of Lollipop plot designed by NG-Circos; data are from Schultheis et al. (18). (E) Demo of COMPARE module in NG-Circos. Mutations in the PVT1 promoter change enhancer target genes. Wig plot shows the H3K4me3 (blue) and H3K9me3 (red) modifications (19). (F) Demo of LocusZoom plot designed by NG-Circos. The module names of tracks in (A–F) are marked with red text.

