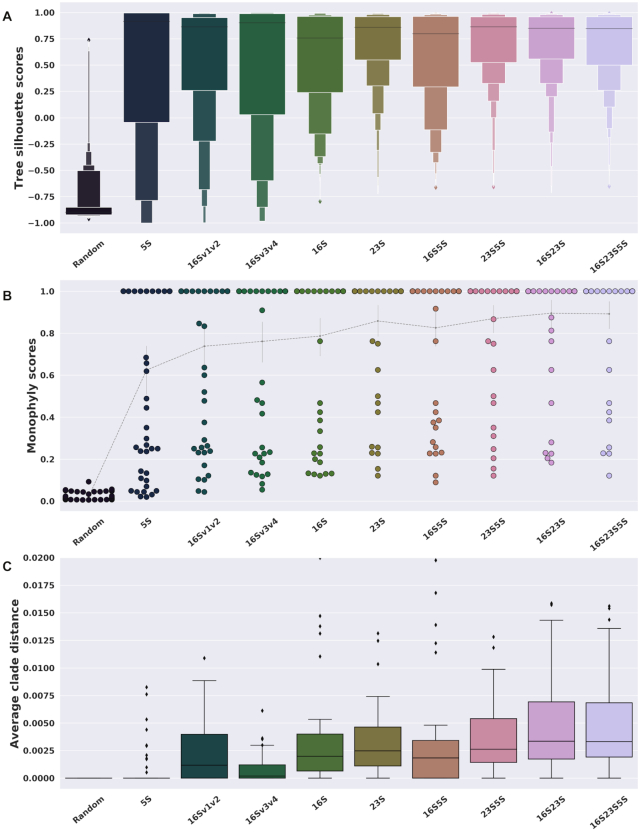
Figure 1.
Silhouette and monophyly scores. Results from maximum likelihood trees using the longest copy of the operon. This shows the changes in phylogenetic and taxonomic resolution apparent when either: (i) just a fragment of a gene (regions v1+v2 or v3+v4 of the 16S rRNA), (ii) a whole gene or (iii) several concatenated genes are analyzed. (A) The silhouette score describes how close each strain is to others from the same species, compared to the closest strain from a different species. (B) Monophyly scores are the fraction of strains from the same species below their last common ancestor. (C) The average patristic distance between monophyletic strains is the average distance between strains below the most diverse monophyletic clade of each species. The Y-axis is truncated at 0.02.

