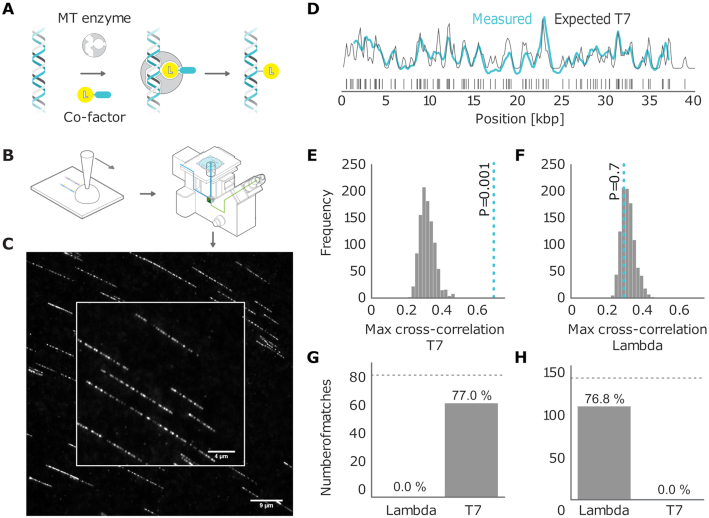
Figure 1.
(A) Graphical sketch of the enzymatic labeling procedure. (B) After enzymatic labeling, DNA fragments are surface deposited and overstretched using a ‘rolling droplet’ procedure (28), followed by fluorescence imaging. (C) Representative image of labeled T7 DNA molecules stretched on a coated coverslip, obtained by wide-field fluorescence microscopy imaging. (D) Measured DNA map of one of the imaged molecules (cyan) overlaid with the T7 expected DNA map (black). (E and F) Histograms of the randomized matching scores corresponding to the maximum cross-correlations of the measured DNA map with the reshuffled expected DNA maps of T7 and lambda. The vertical dotted line indicates the observed matching score of the measured DNA map with the expected DNA map, with low  -value for T7 (ground truth) (E) and high
  -value for lambda (control) (F). (G) Results of the matching of 87 T7 DNA molecules imaged by wide-field microscopy to the expected DNA maps of bacteriophages lambda and T7 (
 ). (H) Results of the matching of 142 lambda DNA molecules imaged by wide-field microscopy to the expected DNA maps of bacteriophages lambda and T7 (
 ). The horizontal dotted line indicates the total amount of DNA maps concerned.

