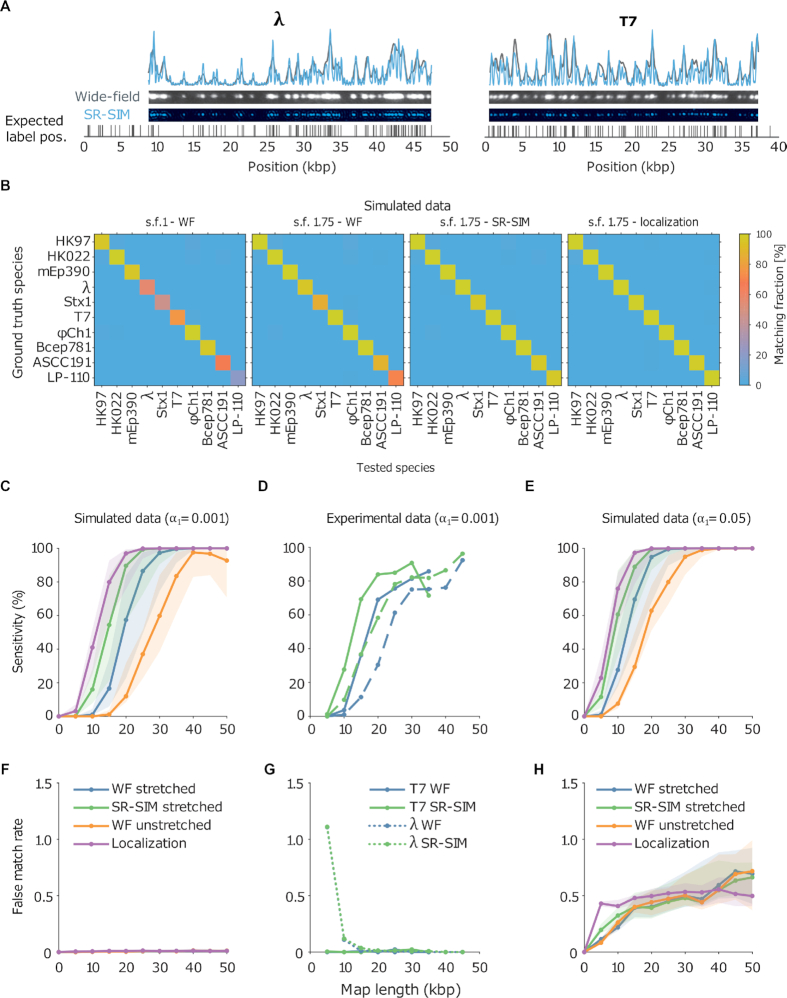
Figure 2.
(A) Examples of experimental microscopy images of bacteriophage lambda and T7 DNA fragments, obtained in wide-field (blue) and by SR-SIM (green). The corresponding fluorescence intensity traces are shown at the top. The traces are placed at the location of the genome found by maximizing the cross-correlation as described in the ‘Materials and Methods’ section. The black vertical lines below the traces indicate the expected dye positions (i.e. the locations of the recognition sequence in the full genome). (B) Assignation matrices for 10000 simulated DNA fragments drawn from the full genome of 10 different bacteriophage species and matched to the same 10 species. Significance threshold  . Different methods for collecting the DNA fragment measurements are compared. From left to right: Unstretched DNA fragments imaged by wide-field microscopy; Overstretched DNA fragments (stretching factor 1.75) imaged by wide-field microscopy; Overstretched DNA fragments (stretching factor 1.75) imaged by SR-SIM microscopy; Overstretched DNA fragments (stretching factor 1.75) imaged by localization microscopy. See Supplementary Section S3.3, for more detailed versions of the assignation matrices. (C) Simulated data: Bacteriophage identification sensitivity as a function of simulated DNA fragment length (). Solid lines indicate the median sensitivity over all the 10 species. The shaded areas are circumscribed by the 25th and the 75th percentile of the sensitivity values obtained for the set of 10 different species. (D) Experimental data: Identification sensitivity as a function of DNA fragment length (
 ). (E) Simulated data: Identification sensitivity as a function of simulated DNA fragment length (
 ). (F) Simulated data: False matching rate as a function of simulated DNA fragment length (
 ). The shaded areas are circumscribed by the 25th and the 75th percentile of the false matching rate values obtained for the set of 10 different species. (G) Experimental data: False matching rate as a function of DNA fragment length (
 ). (H) Simulated data: False matching rate as a function of simulated DNA fragment length (
 ).
).

