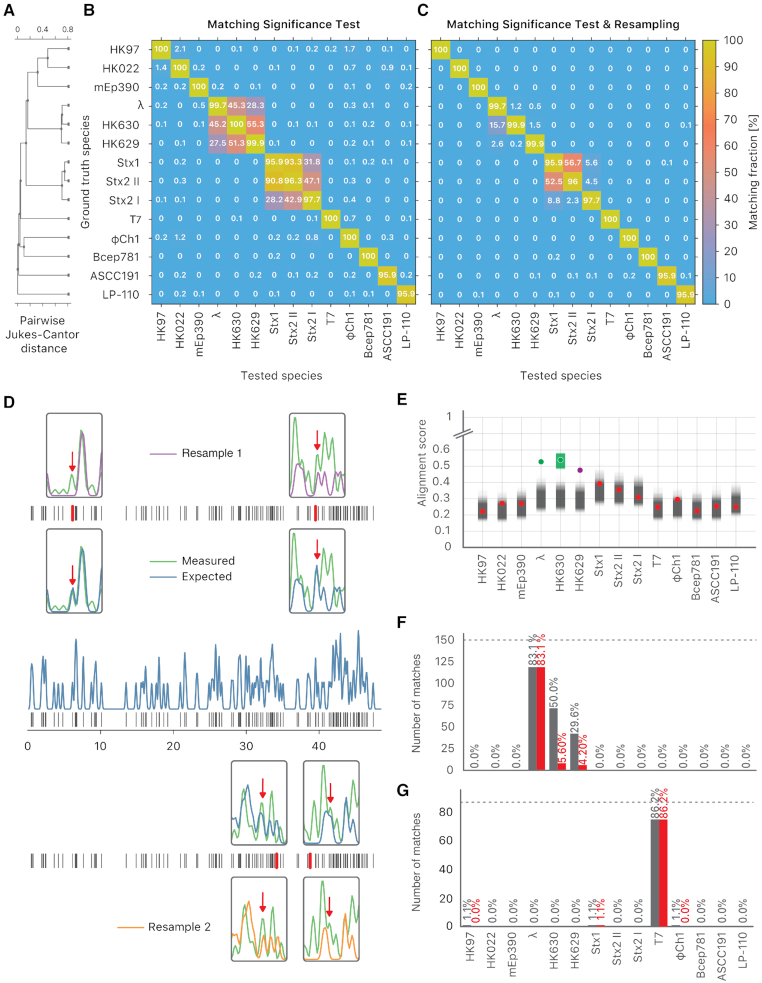
Figure 3.
The resampling step improves specificity. (A) Phylogenetic tree of the selected bacteriophages, constructed from the pairwise Jukes-Cantor distance between their sequences. (B) Assignation matrix showing matching percentages yielded by the matching significance test for 1000 simulated wide-field data traces per ground truth species. Significance threshold  . Note how the regions of confusion between species correspond to short sequence distances in panel (A). (C) Assignation matrix showing matching percentages yielded by the matching significance test and the resampling step for the same data traces as in panel (B). Significance threshold
  . Note the reduced confusion in the regions of short sequence distances. (D) Schematic representation of the resampling step. Intensity trace of a measured lambda DNA molecule (green) overlaid with the ideal trace of the same molecule (blue). Underlying dye locations are indicated by black vertical lines. The resampling of the ideal trace is performed by randomly removing two dye locations (red vertical lines) from the matching region (gray box). Two examples of resampled ideal traces are shown (orange and purple). (E) Schematic representation showing the distributions of the maximum cross-correlation scores yielded by the matching significance test and the resampling step, respectively. Experimental data for one measured lambda DNA molecule. The scores for the expected DNA traces are shown by colored dots. The greyscale distributions refer to the randomized scores used for the matching significance test. Red dots indicate nonsignificant scores (
 ). The green and purple dots indicate significant scores (
 ). The highest score was found for the tested species HK630 whose ideal trace is therefore resampled within the matching region (green distribution). The score for the tested species lambda was found to be reasonably drawn from the green distribution. The additional match to HK629 can be safely ruled out since its score falls significantly outside the green distribution. The algorithm therefore assigns the DNA map to HK630 and lambda at the same time. (F, gray bars) Results of the matching of 142 lambda DNA molecules, yielded by the matching significance test (experimental data, SR-SIM microscopy,
  ). The dotted line indicates the total amount of DNA maps concerned. (F, red bars) Results of the matching of the same molecules, yielded by additionally applying the resampling step (
 ). (G, gray bars) Results of the matching of 87 T7 DNA molecules, yielded by the matching significance test (experimental data, SR-SIM microscopy,
  ). The dotted line indicates the total amount of DNA maps concerned. (G, red bars) Results of the matching of the same molecules yielded by additionally applying the resampling step (
 ).
).

