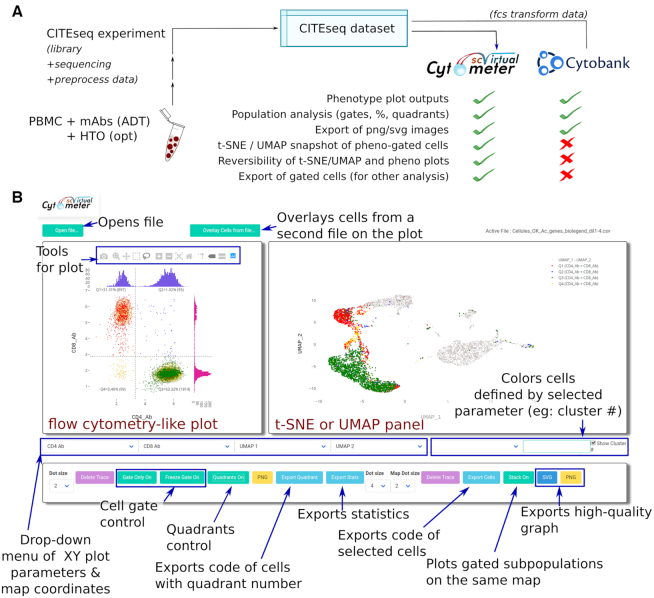
Figure 1.
The PBMC from a healthy individual were labeled with HTO and ADT mixes, and studied by CITE-seq, prior to pre-processing by Seurat of the data and analysis of the cell phenotypes using either the flow cytometry software Cytobank or Single-Cell Virtual Cytometer. (A) Comparison of options performed by either software. (B) Screenshot of the Single-Cell Virtual Cytometer interface displaying selection tools, a phenotype plot (left panel), and its corresponding transcriptome-based UMAP/t-SNE map (right panel). This panel may also display with colors those cells eventually delineated by gates or quadrants in the phenotype panel.

