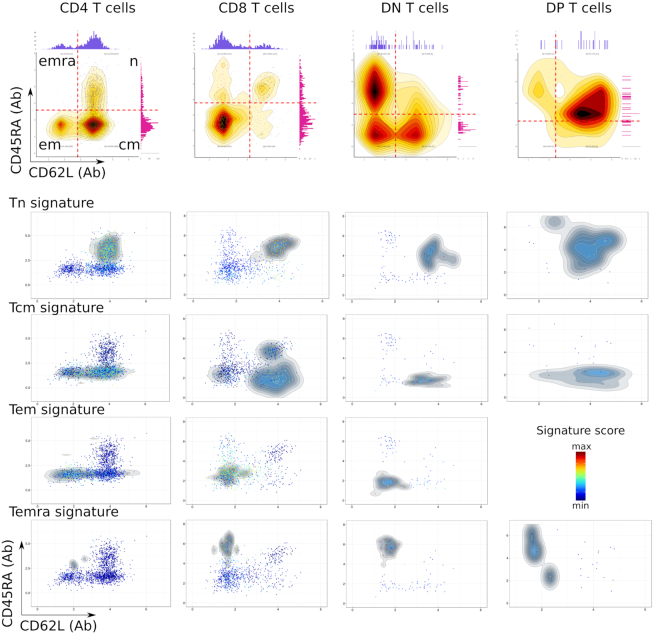
Figure 3.
Cell surface phenotype (top) and gene signatures (bottom) of differentiation stages in T lymphocytes among 6k PBMC from an healthy individual. The gated CD3+ cells were subdivided according to cell surface markers as CD4+ T, CD8+ T, CD4−CD8− (DN) T and CD4+CD8+ (DP) T lymphocytes. Each of these subset was then gated and analyzed for expression of the cell surface CD62L and CD45RA markers. This dataset did not encompass Tem cells among the DP T lymphocytes.

