Figure 1.
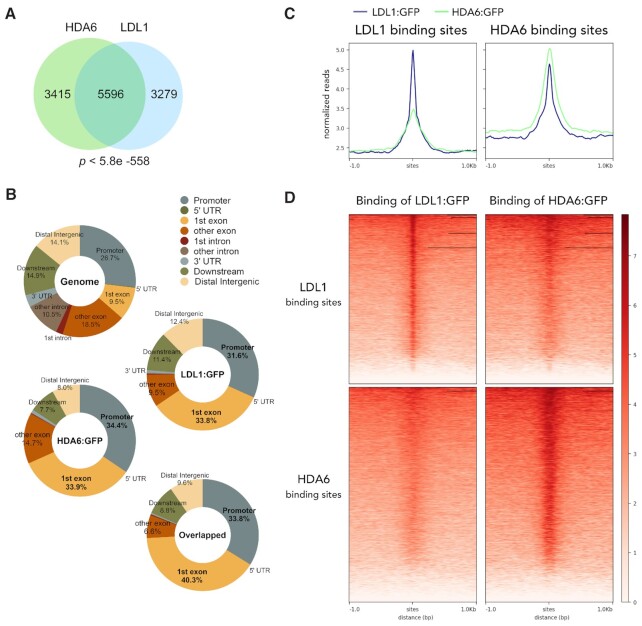
HDA6 and LDL1 show similar binding patterns in Arabidopsis. (A) A Venn diagram showing statistically significant overlap between HDA6 binding peaks and LDL1 binding peaks (5596 peaks; P < 5.8e -558, hypergeometric test). (B) Pie charts showing the distribution of HDA6 and LDL1 in annotated genic and intergenic regions in the genome. (C) The mean density of HDA6 and LDL1 occupancy at all LDL1-associated sites or HDA6-associated sites. The average HDA6 and LDL1 binding signal within 1 kb genomic regions flanking the center of LDL1 or HDA6 peaks is shown. (D) Heat map representation of the cooccupancy of HDA6 and LDL1 in the genome. Each horizontal line represents an LDL1- or HDA6-bound region, and the signal intensity is shown for LDL1 binding and HDA6 binding (center). Columns show the genomic region surrounding each LDL1 or HDA6 peak. Signal intensity is indicated by the shade of red.

