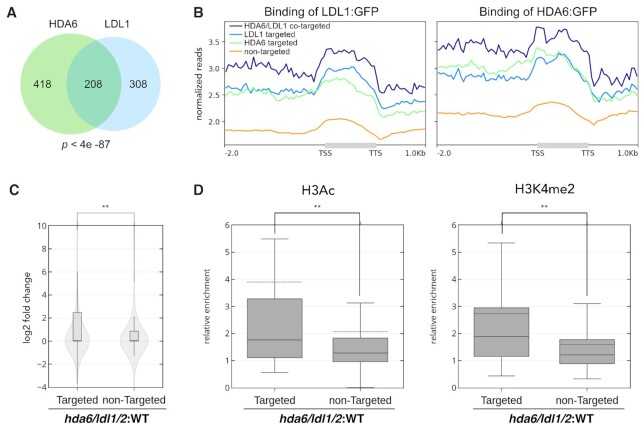
Figure 3.
The expression of H3Ac and H3K4me2 in HDA6/LDL1-targeted lncRNAs is increased in hda6/ldl1/2 compared to WT. (A) A Venn diagram showing statistically significant overlap between lncRNAs targeted by HDA6 and those targeted by LDL1 (208 lncRNAs; P < 4e -87, hypergeometric test). (B) Metagene ChIP-seq binding profiles of HDA6 and LDL1 in HDA6-targeted lncRNAs, LDL1-targeted lncRNAs, HDA6/LDL1-cotargeted lncRNAs and lncRNAs not targeted by HDA6 or LDL1. The profile is from 2 kb upstream of the TSS to 1 kb downstream of the TTS, and the gene lengths were scaled to the same size. (C) Violin plots with boxplots showing the relative expression on the HDA6/LDL1-cotargeted and nontargeted lncRNAs in hda6/ldl1/2 compared to those in WT. **P < 0.001 (Student's t-test). (D) Boxplots showing the relative enrichment of H3Ac and H3K4me2 in the HDA6/LDL1-cotargeted and non-targeted lncRNAs in hda6/ldl1/2 compared to those in WT. The dotted line indicates the mean value of each group. **P < 0.001 (Student's t-test).

