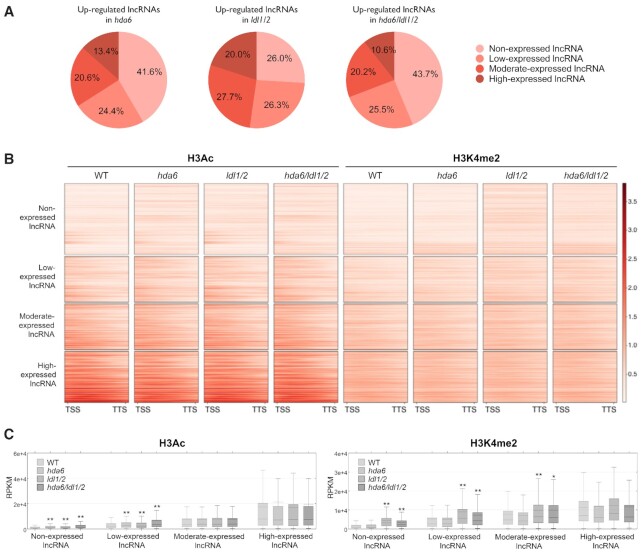
Figure 4.
The H3Ac and H3K4me2 levels of lncRNAs that are nonexpressed or show low expression are increased in hda6/ldl1/2. (A) Pie chart showing the distribution of lncRNAs that were non-expressed or showed low-, moderate- or high- expression among the lncRNAs that were upregulated in hda6, ldl1/2 and hda6/ldl1/2. (B) H3Ac and H3K4me2 plot heatmap of lncRNAs in WT, hda6, ldl1/2 and hda6/ldl1/2 arranged by their expression levels in WT. Each horizontal line represents one lncRNA, and the signal intensity is shown for H3Ac or H3K4me2 levels in WT, hda6, ldl1/2 and hda6/ldl1/2. Signal intensity is indicated by the shade of red. (C) Boxplots showing the H3Ac and H3K4me2 levels of lncRNAs that were non-expressed or showed low-, moderate- or high-expression in WT, hda6, ldl1/2 and hda6/ldl1/2. The dotted line indicates the mean value of each group. *P < 0.05, **P < 0.005 (Student's t-test).

