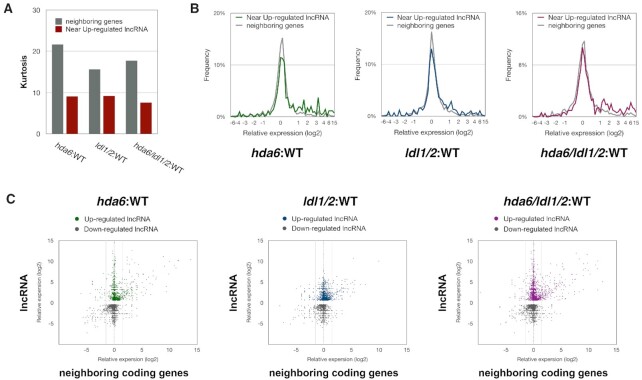
Figure 5.
The expression changes in neighboring coding genes located near HDA6/LDL1/2-regulated lncRNAs. (A) The statistical kurtosis values of the relative expression levels in WT-hda6, WT-ldl1/2 and WT-hda6/ldl1/2. All annotated neighboring coding genes (gray) (15) and the neighboring coding genes located close to the upregulated lncRNAs (red) are presented. (B) The distribution of relative expression levels in WT-hda6, WT-ldl1/2 and WT-hda6/ldl1/2. Data is shown for all annotated neighboring coding genes (15) and the neighboring coding genes located close to upregulated lncRNAs. (C) X-Y scatter plot showing the relative expression levels of the lncRNAs and their neighboring genes in WT-hda6, WT-ldl1/2 and WT-hda6/ldl1/2.

