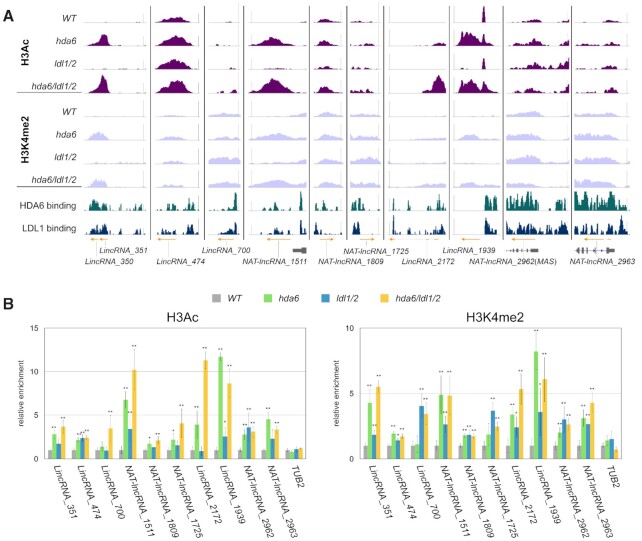
Figure 7.
H3Ac and H3K4me2 in the lncRNAs regulated by HDA6-LDL1/2. (A) Integrated Genome Viewer showing H3Ac and H3K4me2 peaks in WT, hda6, ldl1/2 and hda6/ldl1/2 and the binding of HDA6 and LDL1 in the selected lncRNA genes. Orange arrows indicate transcripts of lncRNA genes from previously published data (15). Bars: normalized reads = 5. (B) ChIP analysis of H3Ac and H3K4me2 levels of the selected lncRNA genes. ChIP assays were performed with H3K9K14Ac and H3K4me2 antibodies. The relative enrichment was determined by qRT-PCR and normalized to ACT2. Error bars correspond to standard deviations from three biological replicates. *: P < 0.05, **: P < 0.005 (Student's t-test).

