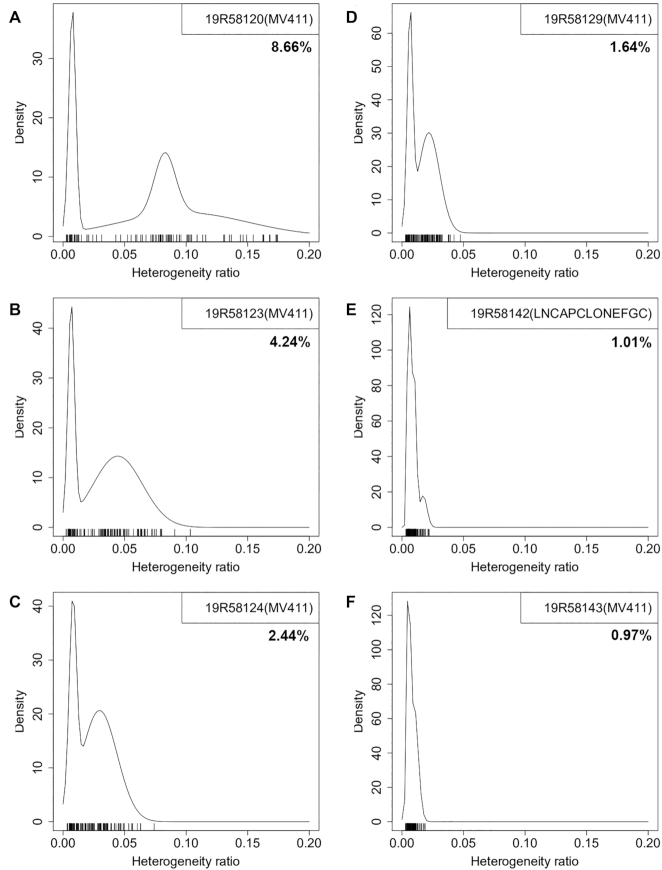
Figure 2.
The heterogeneity ratio can be used to detect and quantify contamination. (A–D) Serial mixes of cell lines MV-4-11 (MV411) and LNCaP clone FGC (LNCAPCLONEFGC) with cell ratios of 5%, 2.5%, 1.25% and 0.625% for the latter; (E) pure LNCaP clone FGC cell line; and (F) pure MV-4-11 cell line. Each tick above the horizontal axis represents an informative SNP site with corresponding SNP heterogeneity ratio. Probability density was estimated by assuming a two/three-component Gaussian mixture. Sample serial number is labeled in the top-right box with the major component cell line in parentheses. Sample heterogeneity ratio is shown underneath.

