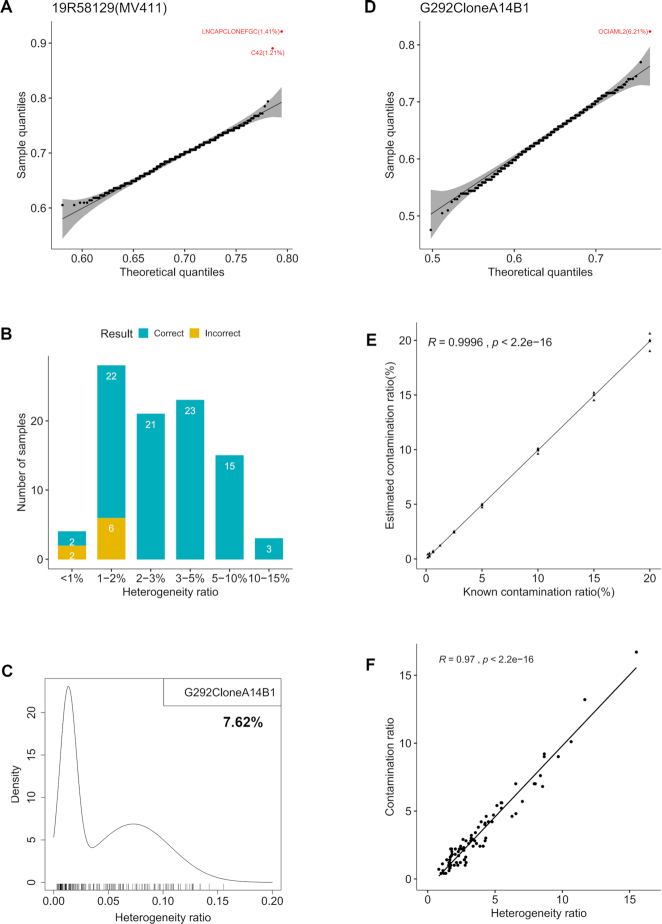
Figure 3.
Contamination detection, contaminant inference and contamination ratio estimation. (A) Sample 19R58129 is MV-4-11 mixed with minor contaminating cell line LNCaP clone FGC (LNCAPCLONEFGC). LNCAPCLONEFGC was correctly identified as the contaminant (P-value = 5.01E−17) with a contamination ratio of 1.41%. LNCaP-C4-2 (C42) and LNCAPCLONEFGC were both derived from LNCaP and share high genetic identity (32). In the quantile–quantile plot, each dot is a reference cell line; theoretical and sample quantiles were calculated from a beta distribution fitted to genotype similarities between MV-4-11 and 1055 reference cell lines. The 99% confidence band is shaded. (B) Accuracy of inferring the contaminating second cell line in a cell line under different heterogeneity ratios. A total of 94 cell line samples with known contaminating second cell line were tested; samples were binned by heterogeneity ratio. (C) Cell line ‘G-292 clone A141B1’ had a sample heterogeneity ratio of 7.62% with a distinct right peak in the probability density of SNP heterogeneity ratios, indicating it was contaminated. (D) OCI-AML-2 was inferred as the contaminant (P-value = 1.58E−07) in cell line ‘G-292 clone A141B1’ with a contamination ratio of 6.21%. (E) Near-perfect correlation between estimated and known contamination ratios in simulated cell line mixtures. (F) High correlation between heterogeneity ratios and contamination ratios for cell line samples with known contamination.

