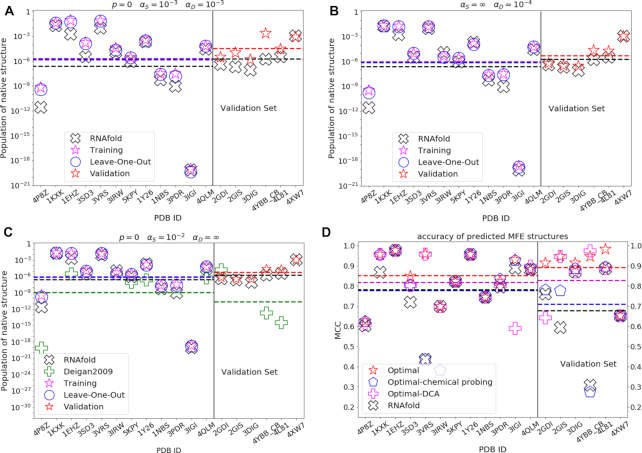
Figure 3.
Comparison of results obtained with unmodified RNAfold and with selected models, respectively: populations of native structures with (A) the best performing model; (B) the best performing model with DCA data only; (C) the best performing model with chemical probing data only. (D) Matthews correlation coefficients between predicted MFE structures and reference native structures, as obtained with selected (best, DCA-only, chemical probing-only) models and with unmodified RNAfold. Hyperparameters are noted in the figure. Native structure populations obtained with unmodified RNAfold (black cross), with our trained model (magenta star on the training set, red star on the validation set) and in the leave-one-out procedure (blue circle, for each molecule the model is trained on all the other molecules in the training set) are reported. Populations obtained by mapping SHAPE reactivities into penalties with the method in Ref. (15) are reported for comparison (green plus), only for molecules studied in previous work and in panel (C) where chemical probing data only are used. The populations of native structures that we obtain with the trained model are almost always increased for molecules both in the training (left side of the vertical line) and in the validation set (right side), with overfitting occurring in a few cases, where populations lower than obtained with unmodified RNAfold are yielded.

