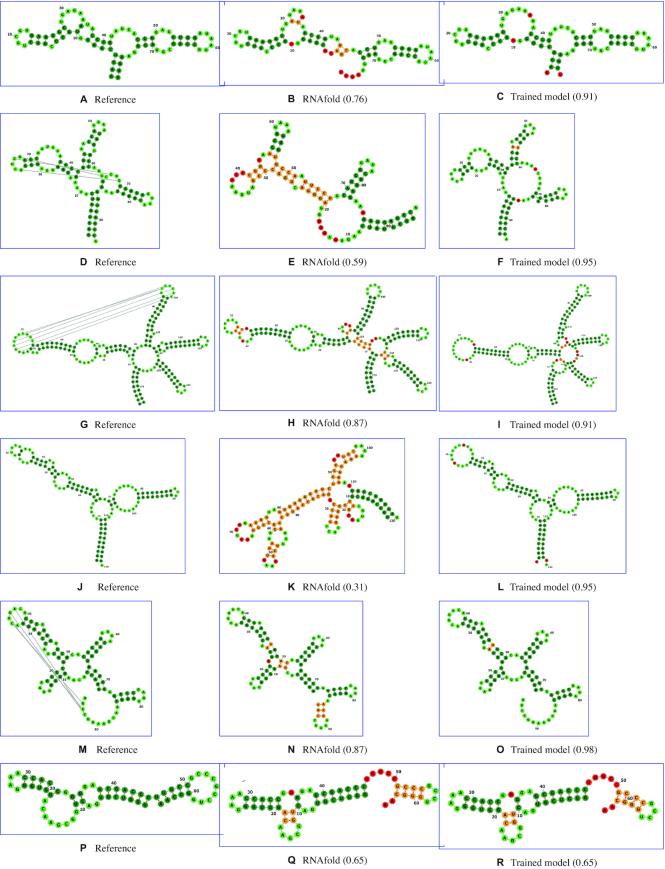
Figure 4.
MFE structure predictions. For each system in the validation set, reference native structure is compared with predicted MFEs. For panel description, see main text. Correctly predicted base pairs (true positives) and unpaired nucleotides (true negatives) are reported in dark green and lime green, respectively. Wrongly predicted base pairs (false positives) and unpaired nucleotides (false negatives) are reported in orange and red, respectively. MCC between prediction and reference is reported in parenthesis. All the relevant improvements in the prediction of these structures are reported in detail in ‘Results’ section. All secondary structure diagrams are drawn with forna (48).

