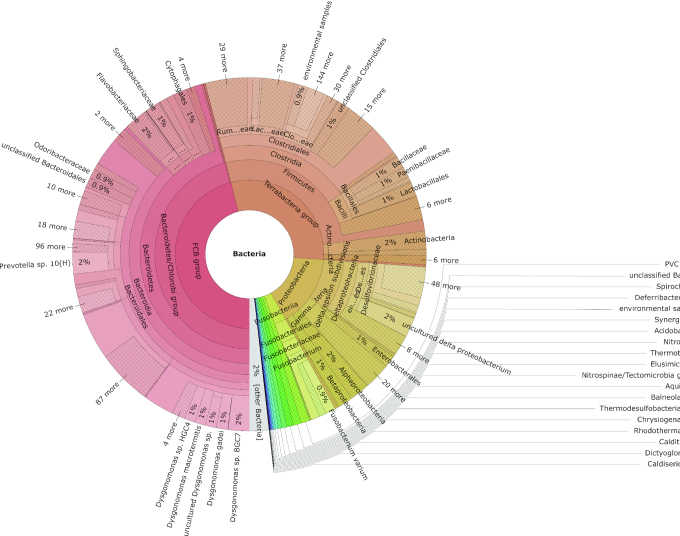
Figure 2.
KronaPlot of the taxonomic annotation of a metagenomics sample (condition 10d). Bacterial taxa distribution of metagenomics data, corresponding to condition 10d. The bacterial taxa are classified by taxonomic hierarchy levels, from higher levels in the center of the chart (Kingdom Bacteria) progressing outward until genus level.

