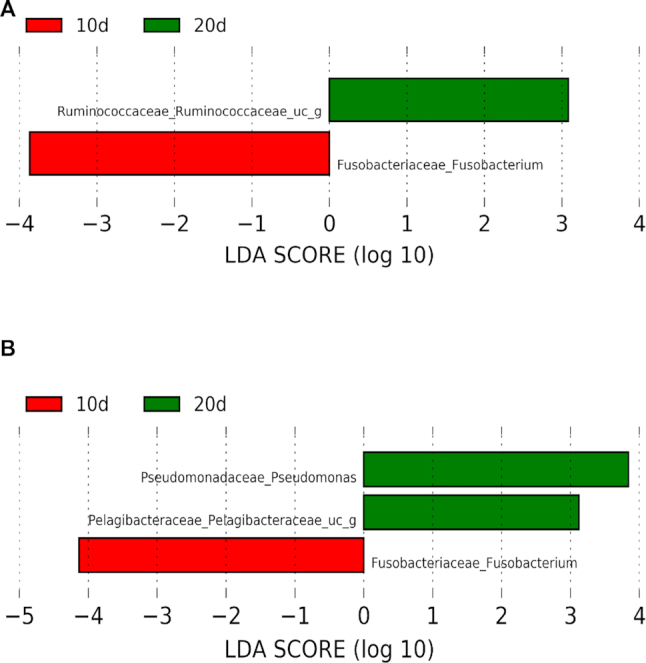
Figure 3.

LEfSe graph of taxonomic annotation of metagenomics (top) and metatranscriptomics (bottom) data comparing the two conditions: 10d and 20d. Taxa with significant different distribution among the two conditions are identified. Only taxa with LDA scores over 2 are shown. Positive LDA scores are assigned to the taxa over-represented in the condition 20d (green), and negative LDA scores to the taxa over-represented in the condition 10d (red). Metagenomics data (A) and metatranscriptomics data (B) are represented.
