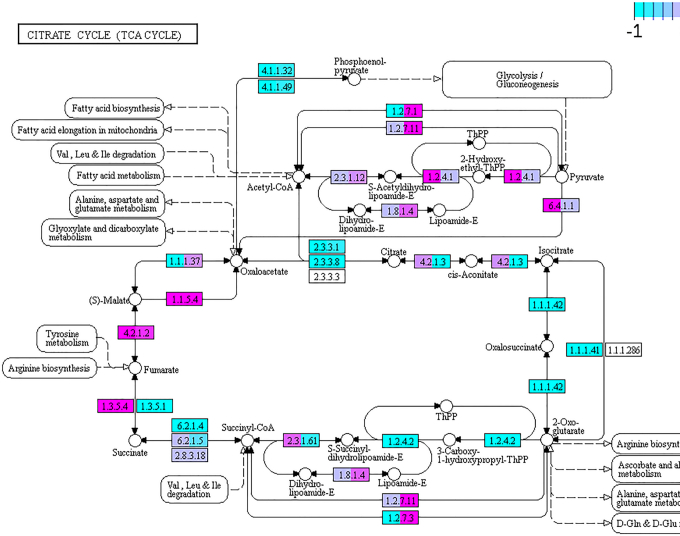
Figure 5.
KEGG Pathview graph of the TCA cycle metabolism route comparing metagenomics versus metatranscriptomics data of the microbiota of 10d and 20d conditions. Some nodes are split between two colors, indicating 10d (left) and 20d (right) conditions. Light blue (−1) depicts genes under-represented in metagenomics (but over-represented in metatranscriptomics), while those marked in pink (1) depicts over-represented genes in metagenomics (but under-represented in metatranscriptomics). In purple, values close to 0 in the ratio metatranscriptomics/metagenomics, indicating no differences in frequency.

