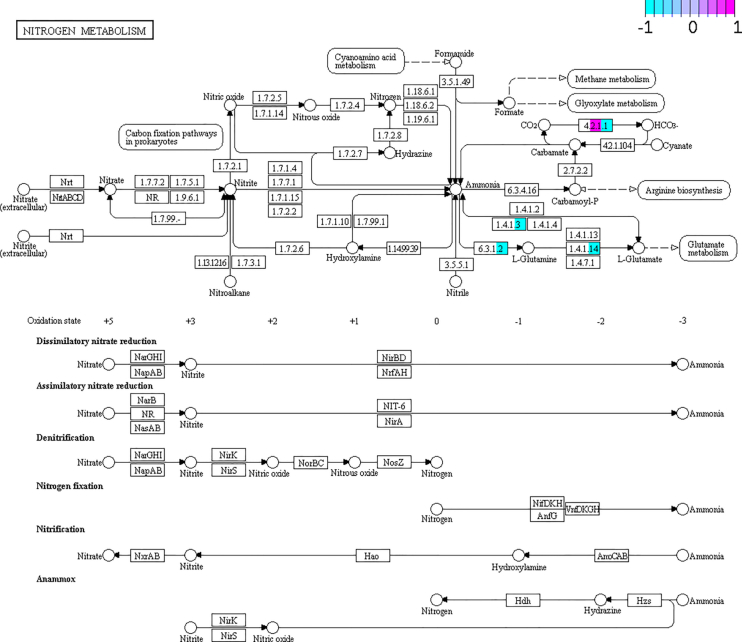
Figure 7.
KEGG Pathview graph of the N metabolism pathways comparing metagenomics/metatranscriptomics/metaproteomics data of the host between 10d and 20d conditions. Some nodes are split between different colors, indicating metagenomics (left), metatranscriptomics (middle) and metaproteomics (right) data. Light blue (−1) depicts genes/transcripts/proteins over-represented in 10d (but under-represented in 20d), while those marked in pink (1) depicts genes/transcripts/proteins over-represented in 20d (but under-represented in 10d). In pruple, values close to 0 in the ratio 10d/20d, indicating no differences in frequency.

