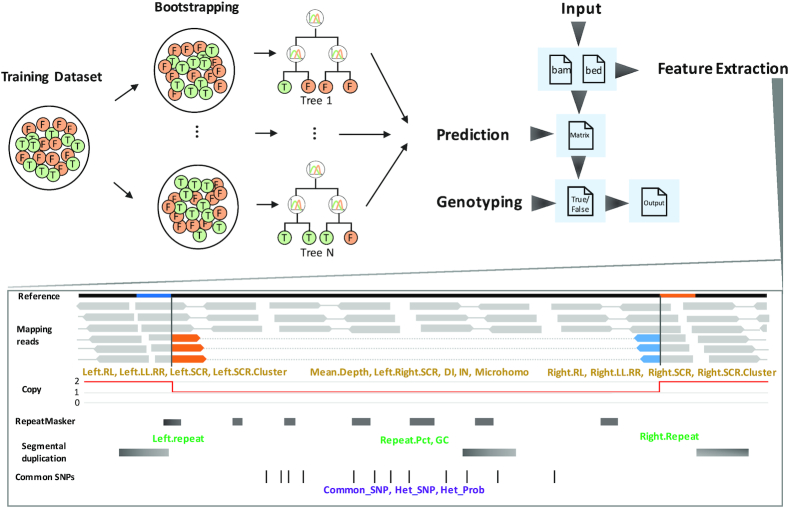
Figure 1.
The workflow of CNV-JACG. The top right panel shows the general workflow of CNV-JACG, which takes bam file(s) and bed file (containing the coordinates of CNVs to-be assessed) as input and goes through the feature extraction, prediction, genotyping processes and finally output the result containing the predicted category (‘true’ or ‘false’), genotype (number of copy) as well as the value of each feature. The top left panel is a schematic diagram of the process of RF model training. Through a bootstrapping sampling process, the model learns from the true and false CNVs about the pattern of 21 features and generate N trees readily for predicting the true and false category for a test CNV. The bottom panel is a schematic diagram of feature extraction, the mapping reads in orange/blue indicates soft-clip reads, and they are mapped to the region with their same color in the reference. The features in yellowish brown are extracted from mapping reads, and those in green are extracted from reference genome as well as the external repetitive region (including RepeatMasker and segmental duplication), the features in purple are extracted from mapping reads and external common SNPs of 1000 Genomes Project.

