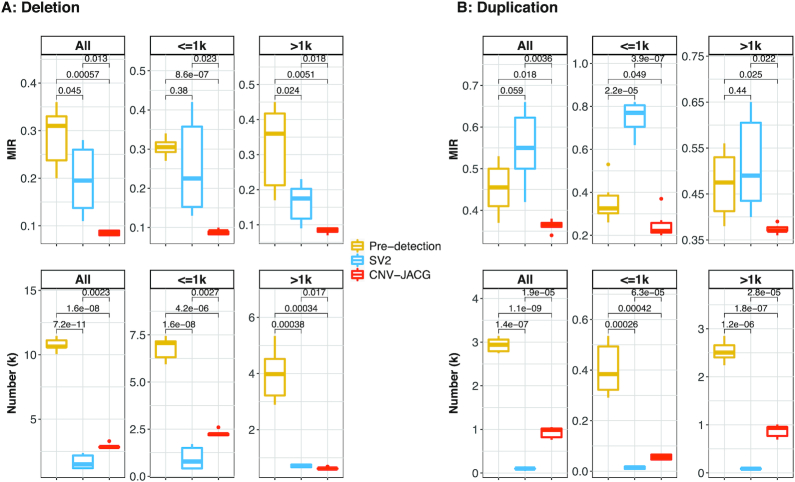
Figure 3.
The Mendelian inconsistency rate and number of CNVs in six trios. The box plots of the Mendelian inconsistent rate (MIR) and number of detected deletions (A) and duplications (B) for all, ≤1 kb, and >1 kb obtained by pre-detection, SV2 and CNV-JACG (denoted by different color) for six trios are shown. MIR is the proportion of CNVs that present only in the child but in neither of his/her biological parents. Pre-detection indicates the combined CNV calls detected by CNVnator, Delly, Lumpy and Seeksv. SV2 and CNV-JACG indicate the CNV calls (subset of Pre-detection) assessed to be true by each of them. Boxes denote the interquartile range (IQR). Ranges of whiskers are at most 1.5-fold of the IQR from the box and points outside the whiskers are outliers. P-values were calculated by two-sided t-test.

