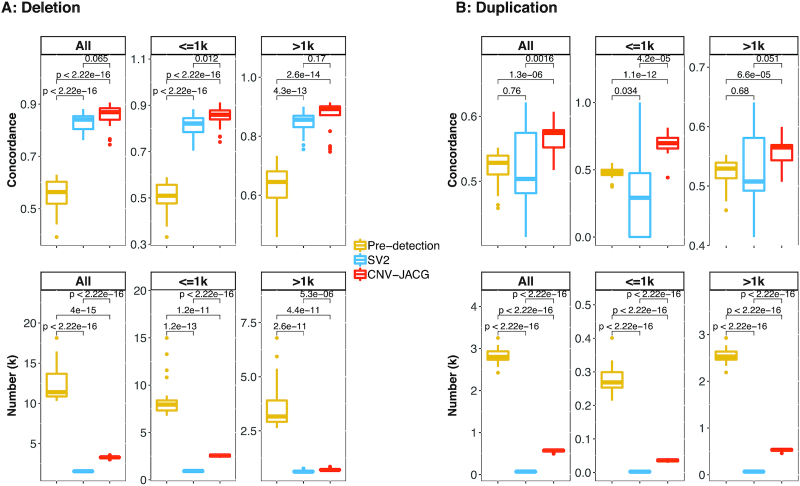
Figure 4.
Concordance of CNVs called between 11 pairs of technical replicates. Box plot of concordance and number for deletions (A) and duplications (B) for all, ≤1k and >1k size range, under pre-detection, SV2 and CNV-JACG (denoted by different box color). Pre-detection indicates the combined CNV calls detected by CNVnator, Delly, Lumpy and Seeksv. SV2 and CNV-JACG indicate the CNV calls (subset of pre-detection) assessed to be true by each of them. Each box consists of 22 values, e.g., we calculated two concordance rates for both cases of each replicate pair. Boxes denote the IQR, and the ranges of whiskers are at most 1.5-fold of the IQR from the box, the points outside whiskers are outliers. P-values were calculated by two-sided t-test.

