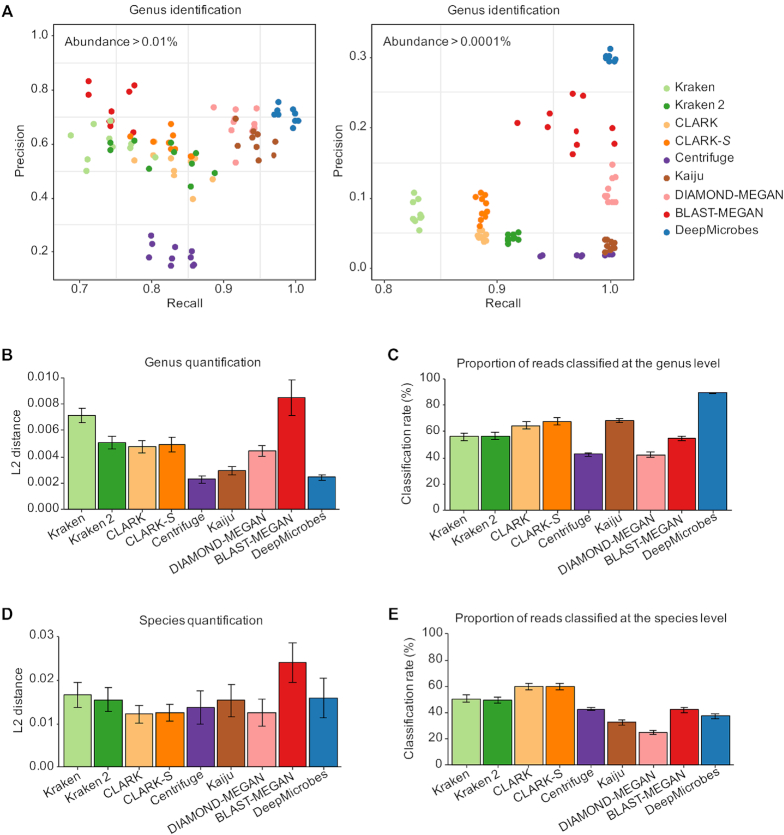
Figure 3.
Benchmark results of DeepMicrobes and other taxonomic classification tools on the ten mock communities. (A) Genus-level precision and recall measured at the community level using abundance cutoff 0.01% and 0.0001%. Each point represents a mock community. A random jitter of 0.005 is added on the recall to reduce overplotting. (B) Distance between the genus abundance profile for each tool compared with the true composition. (C) Genus-level classification rate for each tool. (D) Distance between the species abundance profile for each tool compared with the true composition. These results consider the 14 species included in the reference databases of all the tools in abundance estimation. (E) Species-level classification rate for each tool. The error bars represent standard error.

