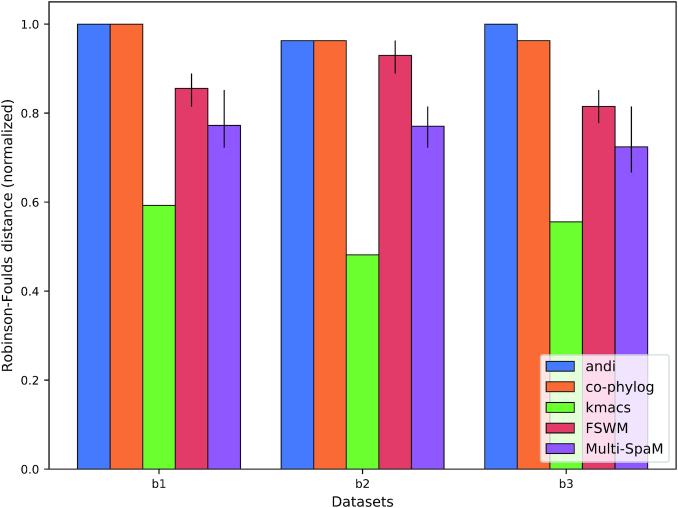
Figure 3.
Average ‘normalized Robinson-Foulds (RF)’ distances between trees calculated with alignment-free methods and reference trees for three sets of simulated bacterial genomes. ‘FSWM’ and ‘Multi-SpaM’ were run 10 times, with different patterns P generated (see the main text). Error bars indicate the lowest and highest RF distances, respectively.

