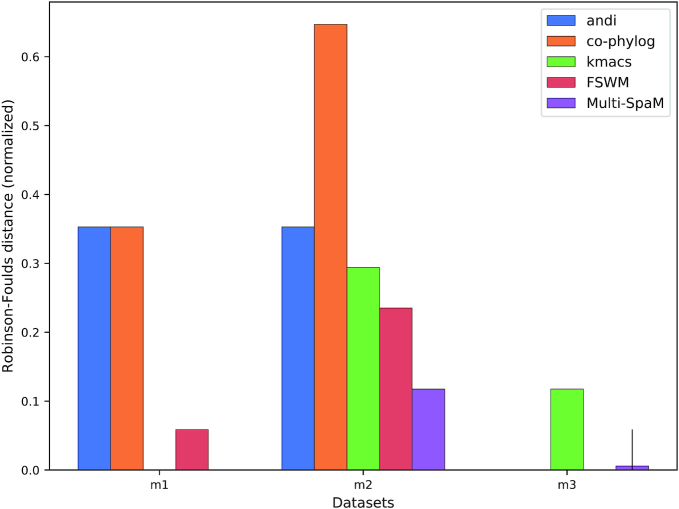
Figure 4.
‘Normalized RF’ distances for three sets of simulated mammalian genomes. If no bar is shown, the RF distance is zero for the respective method and data set. For example, the RF distance between the tree generated by ‘kmacs’ for data set m1 and the reference tree is zero, i.e. here the reference tree topology was precisely reconstructed. Error bars for ‘FSWM’ and ‘Multi-SpaM’ are as in Figure 3.

