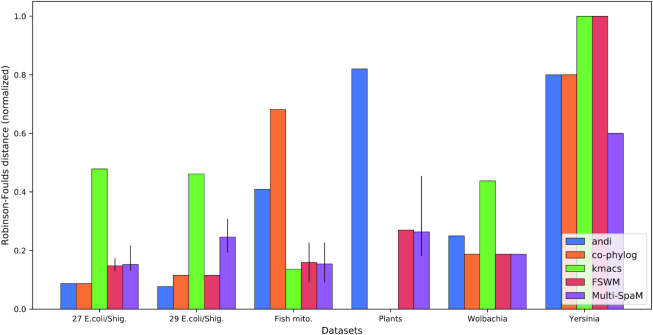
Figure 5.
‘Normalized RF’ distances for six sets of benchmark genomes: 29 E. coli/Shigella genomes, another set of 27 E. coli/Shigella genomes, mitochondrial genomes from 25 different fish species, 14 plant genomes, 19 Wolbachia genomes and 8 Yersinia genomes. Error bars for ‘FSWM ’and ‘Multi-SpaM’ as in Figure 3. Unlike in Figure 4, missing bars for the plant data sets in this figure mean that the programs in question, co-phylog and kmacs, did not terminate on this data set.

