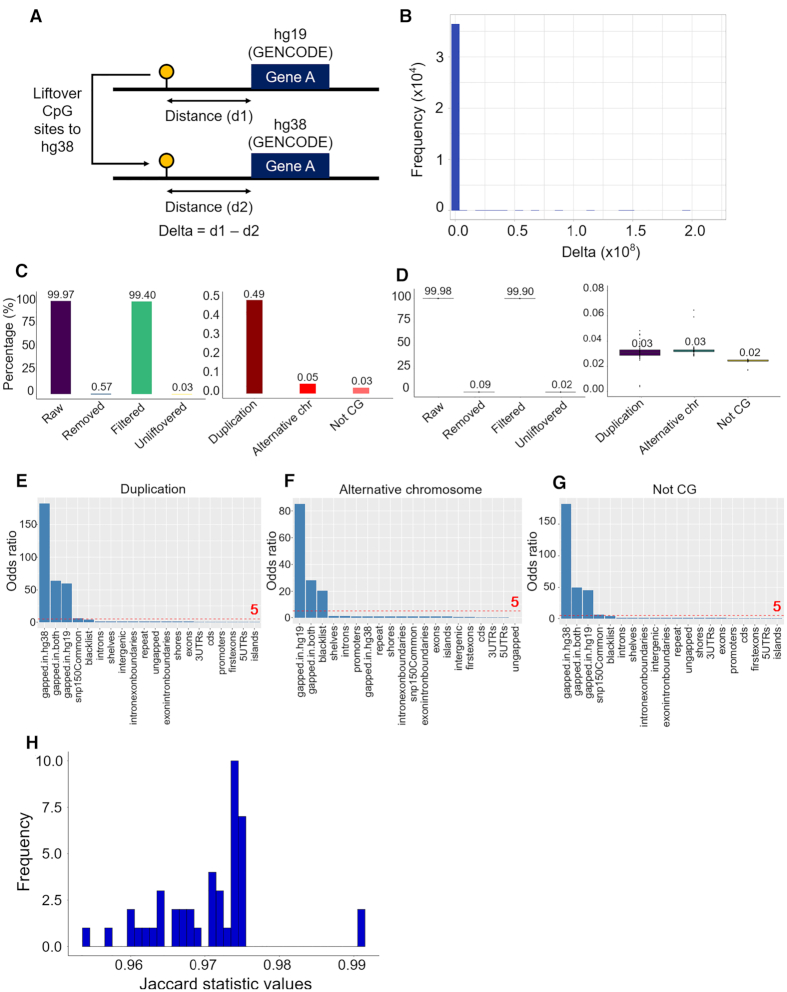
Figure 3.
UCSC liftOver conversion of WGBS data. (A) Steps of analysis to determine if CpG sites are mapped to the correct location. (B) Distribution of delta values by subtracting distance between initial CpGs and gene coordinates on hg19 (d1) by distance between lifted CpGs and gene coordinates on hg38 (d2). (C) UCSC liftOver conversion of the full CpG dataset and details of removed data. (D) UCSC liftOver conversion of 43 WGBS samples and details of removed data. (E) Enrichment analysis of CpG duplication. (F) Enrichment analysis of CpG alternative chromosome. (G) Enrichment analysis of not CG. (H) Distribution of Jaccard statistic values of corresponding CpG coordinates between liftover and alignment methylomes among 43 WGBS samples.

