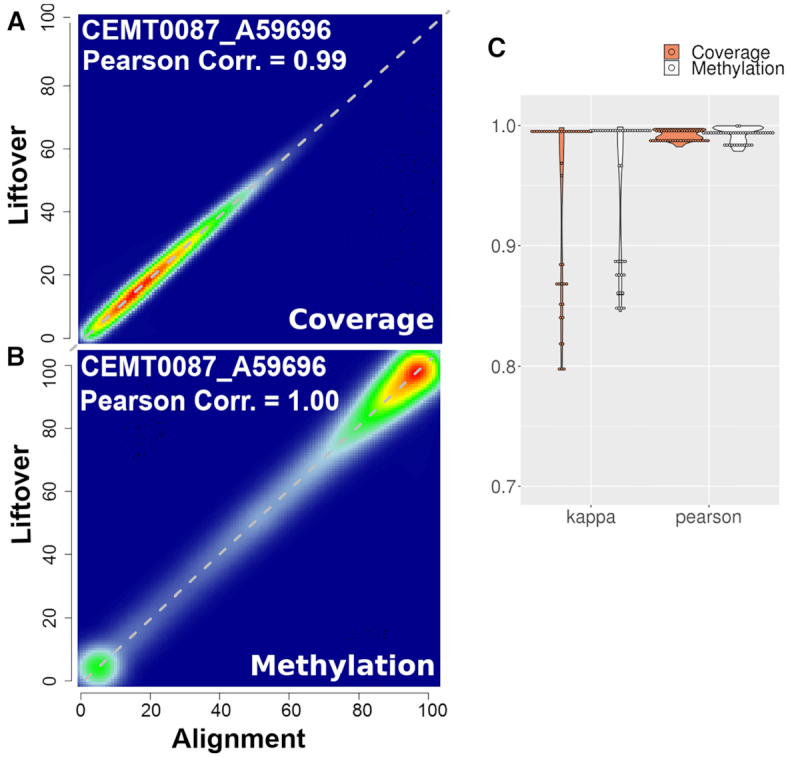
Figure 4.

Liftover preserves coverage and DNA methylation of epigenome. (A) Scatter plot of coverage values between liftover and alignment methylome of sample CEMT0087_A59696. (B) Scatter plot of DNA methylation values between liftover and alignment methylome of sample CEMT0087_A59696. (C) Violin plot of Pearson correlation coefficients and kappa statistics between liftover and alignment methylomes across 43 samples.
