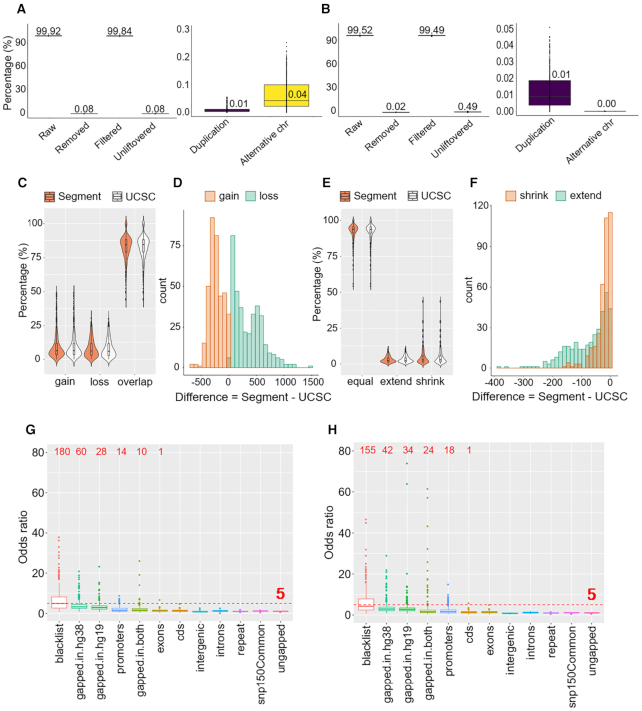
Figure 7.
UCSC liftOver and segment_liftover conversion of 366 ChIP-Seq samples. (A) UCSC liftOver conversion and details of removed data. (B) segment_liftover conversion and details of removed data. (C) Violin plot showing the percentage of gain, loss and overlapping intervals. (D) Histogram showing differences of number of gain and loss intervals between segment_liftover and UCSC liftOver. (E) Violin plot showing the percentage of equal, extend and shrink intervals. (F) Histogram showing differences of number of intervals with extend and shrink in length between segment_liftover and UCSC liftOver. (G) Enrichment analysis of loss and gain intervals in UCSC liftOver liftover versus alignment outputs. (H) Enrichment analysis of loss and gain intervals in segment_liftover liftover versus alignment outputs.

