Figure 1.

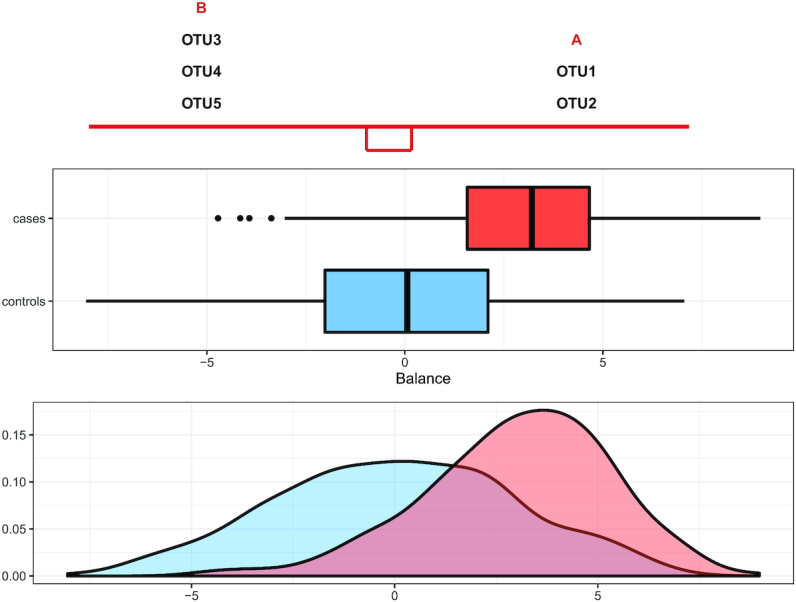
The taxa in group A and group B that constitute the balance. Box plots represent the distribution of balance scores for cases (red) and controls (blue). The density plot of balance scores for cases and controls is shown below.

The taxa in group A and group B that constitute the balance. Box plots represent the distribution of balance scores for cases (red) and controls (blue). The density plot of balance scores for cases and controls is shown below.