Figure 11.

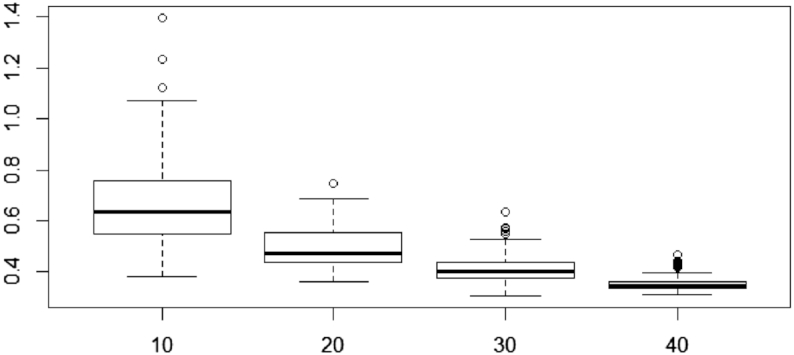
Variability of M after clr transformation [see Equation (19)] for the  scenario, based on the CD dataset. The total number of variables for each simulation scheme is indicated in the x-axis.

Variability of M after clr transformation [see Equation (19)] for the  scenario, based on the CD dataset. The total number of variables for each simulation scheme is indicated in the x-axis.