Figure 1.
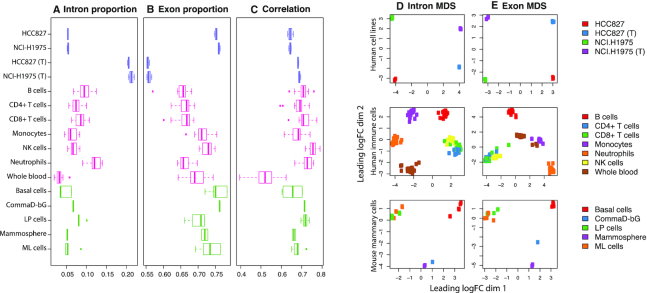
With libraries separated by biological and experimental groups, various statistics are summarized as boxplots across the datasets (distinguished by colour—purple for human cell lines, pink for human immune cells and green for mouse mammary cells) and total RNA samples labelled with a ‘(T)’. (A) Proportion of reads assigned to intron and (B) exon counts. (C) Pearson correlation of gene-level exon log2-counts (log-counts) and gene-level intron log-counts. Log-counts are calculated for genes expressed (count of three or more) in both intron and exon count sets, using an offset of 1. (D) MDS plots of log2-counts-per-million (log-CPM) values calculated using an offset of two for gene-level intron counts and (E) gene-level exon counts for each of the three datasets. MDS plots were created using limma’s (32) plotMDS function based on the top 500 most variable genes.

