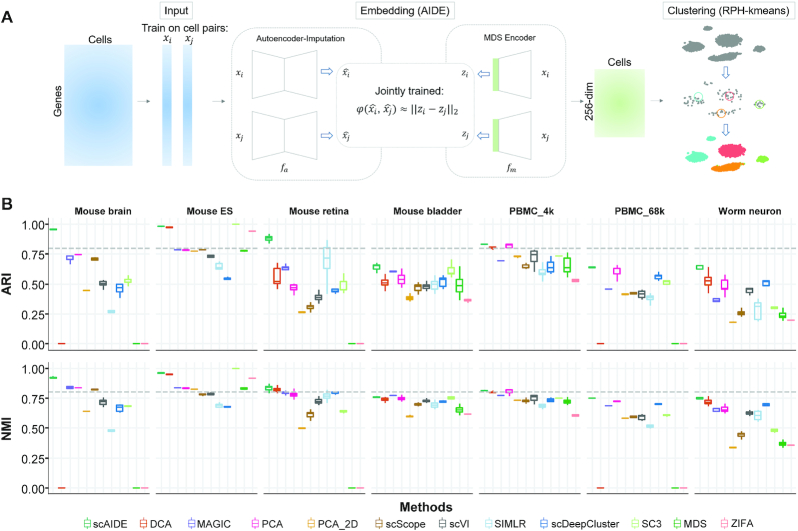
Figure 1.
Overview and performance of scAIDE. (A) A schematic overview of the architecture of scAIDE. (B) The overall comparison of ARI and NMI performance on seven single-cell datasets. The dotted gray line represents a threshold of 0.8. For scDeepCluster and SC3, each algorithm was run five times to generate a distribution of results. For methods that involved a dimension reduction step, five embeddings were generated with the same parameters, and we obtained the boxplot by applying clustering to each embedding 10 times. We set k as the number of known cell type labels for comparison. Observations at 0 indicate that the experiment was not performed either because of insufficient memory or running time was >4 h.

