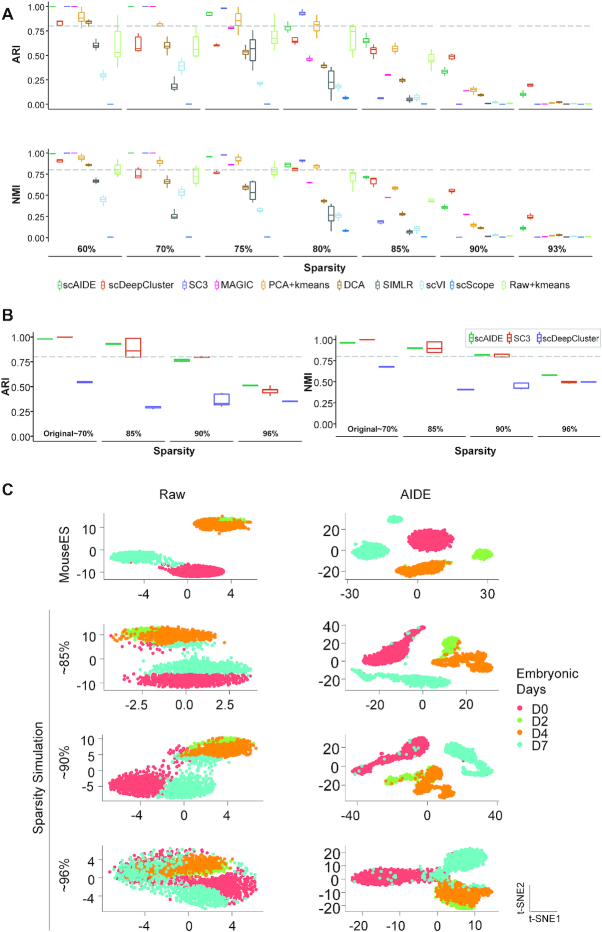
Figure 2.
Dropout simulation and analysis. (A) Fully simulated single-cell datasets were generated using splatter, ranging from 60% sparsity to 93%. Boxplots follow similar settings to Figure 1B. We used the default parameters for scAIDE and set the maximum training steps to 40 000 without early stop. (B) Simulations were obtained by adding dropout events to the mouse ES dataset, increasing from 70% to about 96%. We used the default parameters for scAIDE. The left panel shows the ARI performance of scAIDE, SC3 and scDeepCluster, similarly for NMI on the right. The boxplots were drawn by running each algorithm five times and obtaining a distribution. (C) t-SNE visualizations of the raw gene expression matrix and the AIDE representation of the mouse ES dataset. Colors represent the true cell labels.

