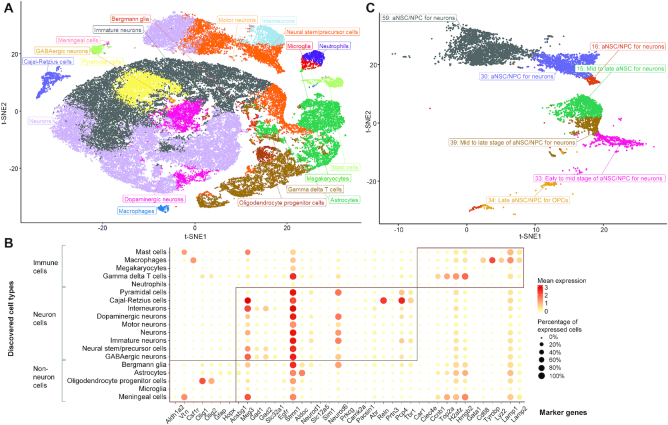
Figure 4.
Putative and rare cell type discovery in the 1.3 million neural cell dataset. (A) t-SNE visualization of the AIDE embedding on 5% sampled data from the full dataset. Data are sampled based on the 64 clusters obtained from scAIDE. Colors represent the 19 cell type annotations from our biological analysis. (B) t-SNE visualization on cells annotated with the label: neural stem/precursor cells. These correspond to the orange cells in the same position as in A. Annotations were validated by different markers and their respective positioning. NPC: neural progenitor cells; aNSC: activated neural stem cells; OPC: oligodendrocyte progenitor cells. (C) Top significantly expressed marker genes in each respective cell types.

