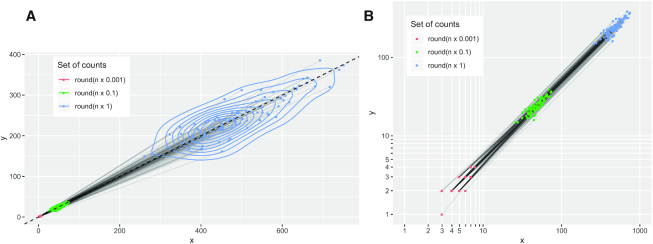
Figure 3.
(A) Imagine an environment populated by species x and y. We take 100 samples and find that there are about 500 of species x in each sample and that there are around half as many of species y in each sample (blue points). To simulate what we might have seen if these species were 10-fold less abundant, we divide all our counts by 10 and round them to the nearest whole number (green points). (This does not simulate sampling variation, but our intent is to illustrate the impact of quantization on counts.) We repeat this process to simulate 100-fold reductions in abundance (red points). (B) As our counts decrease by orders of magnitude, we see (on a log-scale) that the natural number lattice affords a coarser representation of the initial counts.

