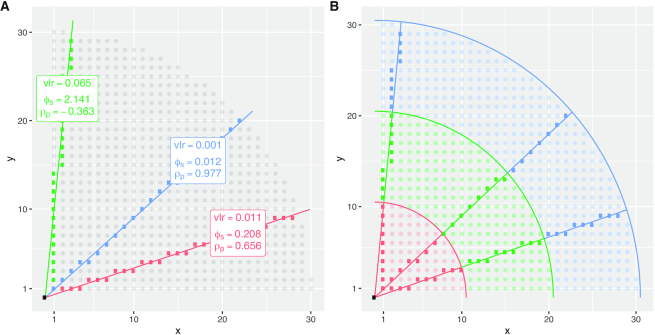
Figure 4.
Lattice compositions cannot, in general, exactly represent proportional relationships between pairs of components, and this affects statistical measures of proportionality. (A) This plot shows three different colored lines of exact proportionality between x and y; the colored points show their discrete lattice approximation. The slopes of the lines are 1/3 (red), 9/10 (blue) and 10/1 (green). The corresponding proportionality statistics of the lattice approximations are shown in the boxes using logarithms to base 10. Note that we have used a third component  = 1 (not shown) to ensure that ϕs and ρp are defined. Also, we have defined the lattice approximation so that 1 is the minimum x and y value to avoid taking logarithms of 0. (B) Keeping the same lines of exact proportionality as in (A), we now use colors to indicate different regions of the natural number lattice from radius 1–10 (red), 10–20 (green) and 20–30 (blue). By sweeping a line of proportionality through positive slopes from 0 to ∞ (i.e. angles 0–90° to the x-axis), we can record the values of vlr, ϕs and ρp in different regions of the lattice approximation.

