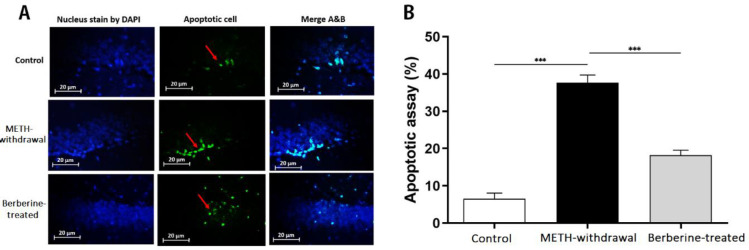
Figure 9.
TUNEL staining in the hippocampus of rats. (A) Nuclei staining by DAPI and apoptotic cells and merge of them from each group (magnification, ×400). (B), The percentage of positive reaction in each group. Red arrows point to apoptotic cells. Scale Bars: 20 µm. Ratio of apoptotic cells is displayed as the mean±SD (n=3 per groups); (***P<0.001)

