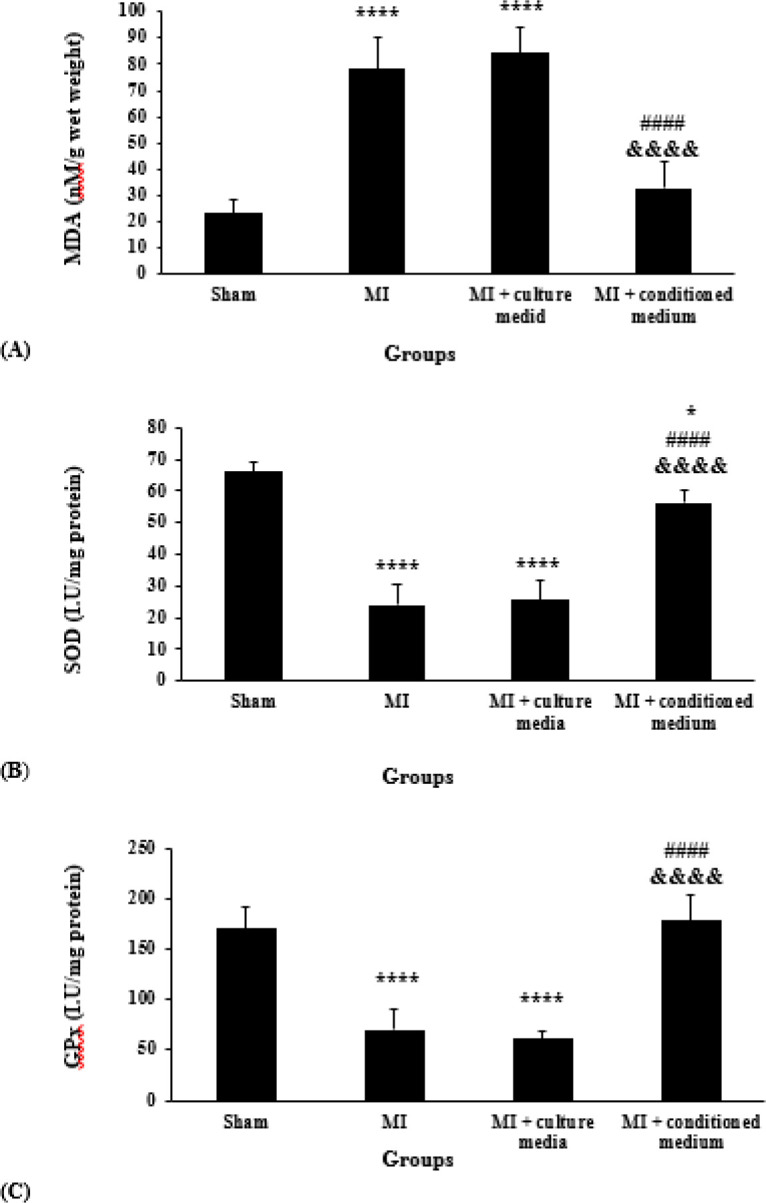
Figure 5.

Myocardial contents of MDA (A); SOD (B); and GPx (C) in different groups (n=5 for each group). The data were expressed as Mean±SD. (* P<0.05 and **** P<0.0001 vs Sham group, P< 0.0001 vs MI group, &&&&P<0.0001 vs MI + culture media group). MDA: Malondialdehyde, SOD: Superoxide Dismutase, GPx: Glutathione Peroxidase, SD: Standard Deviation, MI: Myocardial Infarction
