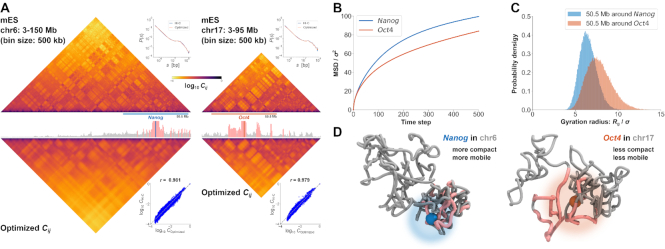
Figure 6.
Demonstrations of PHi-C for Hi-C data of mESCs. (A) PHi-C analysis for chromosomes 6 (left) and 17 (right) of mESCs. (Upper) Contact matrices of the Hi-C experiment (binned at 500 kb), and contact probabilities as a function of genomic distance. (Middle) 4C-like profiles of Nanog (left) and Oct4 (right) loci. High-interaction regions are highlighted (pink). (Lower) Optimized contact matrices by PHi-C, and correlation plots between  and
and  . (B) Theoretical MSD curves of Nanog and Oct4 loci. (C) Probability densities of the gyration radius of 105 conformations for the 50.5-Mb genomic regions around Nanog and Oct4 loci in mESCs. (D) Polymer models derived from PHi-C analysis for Nanog and Oct4 loci on chromosomes 6 and 17, respectively. Pink highlighted regions on the polymer models correspond to the regions in the 4C-like profile of (A).

