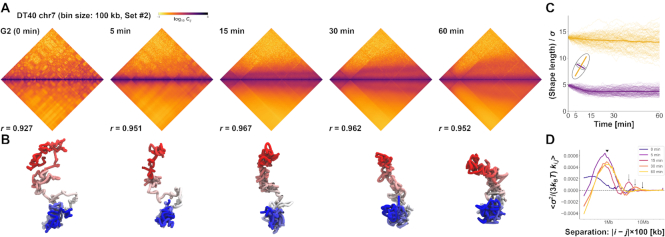
Figure 7.
Demonstrations of PHi-C for Hi-C data of DT-40 cells. (A) PHi-C analysis for chromosome 7 of DT-40 cells at G2 (0 min), 5, 15, 30 and 60 min. Contact matrices of the Hi-C experiment with 100-kb bins (upper) and optimized contact matrices with the correlation value (lower). (B) Snapshots of polymer conformations in a 4D polymer dynamics simulation. (C) Time series of the shape lengths of the major (yellow) and minor (purple) axes for polymer conformations in 100 polymer dynamics simulations starting from the same initial conformation. Thick curves represent the averages. (D) Curves of optimized interaction parameters,  , averaged at each genomic distance (separation, |i − j| × 100 kb). A triangle indicates a position of a local peak inducing compaction within 2 Mb. Arrows indicate positions of a local peak generating periodicity of attractive interactions around 4, 6 and 10 Mb at 15, 30 and 60 min, respectively.

