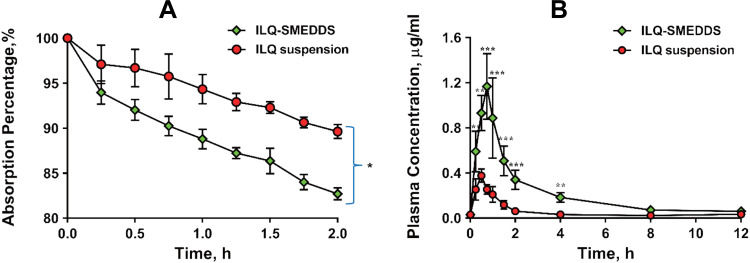
Figure 5.
(A) Absorption percentage curve of ILQ suspension or ILQ-SMEDDS in rats’ proximal jejunum segment after perfusing 2 h with an ILQ dose of 200 μg/mL. Length of jejunum: 12–15cm; Each value represents the mean ± SD, *p < 0.05 (Prism Mann Whitney test, n=3). (B) Mean plasma concentration–time profiles of ILQ in mice after oral administration of ILQ suspension or ILQ-SMEDDS (equivalent dose) at a dose of 35 mg/kg of ILQ. Each value represents the mean ± SD, **p < 0.01, ***p < 0.001. (Each time point, n=3).

