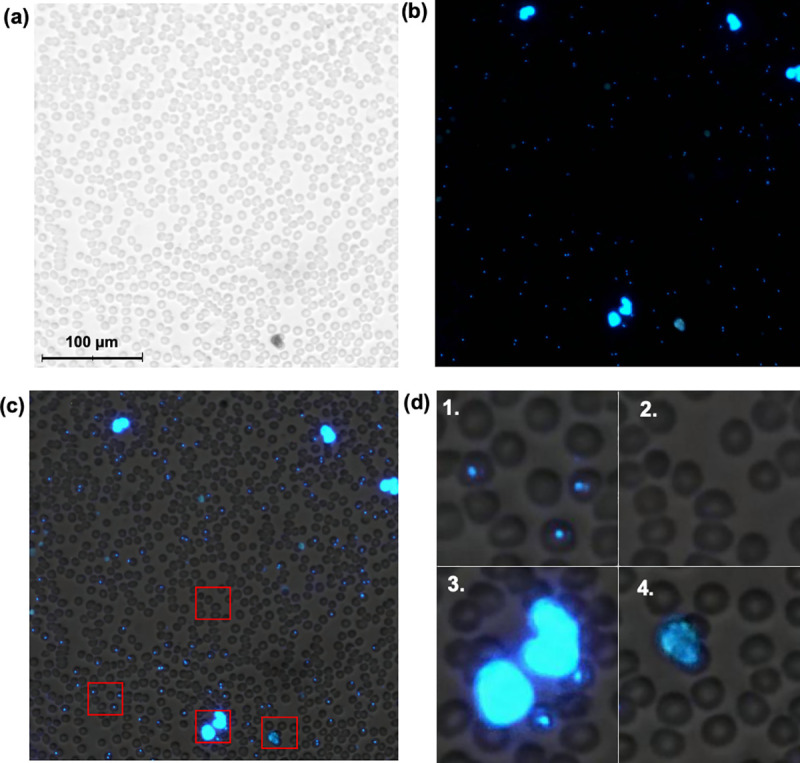
Fig 2. Digitized thin blood smear.

Microscopic field of view (FOV), showing the corresponding (a) brightfield, (b) fluorescence and (c) merged thin blood smear digital images. Red bounding boxes showing enlarged areas with (1) infected red blood cells (RBCs), (2) normal RBCs, (3) leukocytes and (4) fluorescent debris.
