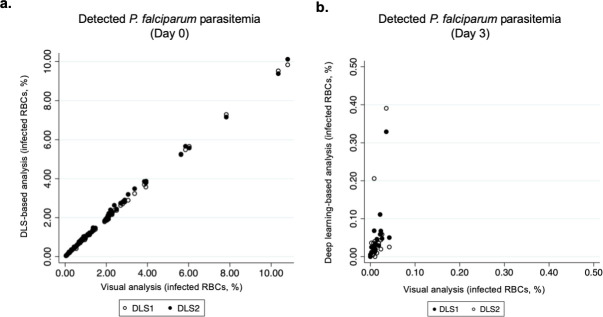
Fig 6. Correlation between detected levels of parasitemia by deep learning-based and visual sample analysis.
Correlation between levels of P. falciparum parasitemia, as detected with the deep learning systems (DLSs), and by visual analysis of the digital samples, collected on (a) Day 0 and (b) Day 3).

